
Shale Crescent Gas Averages $2.85 in 2026 vs. $16.75 in Europe
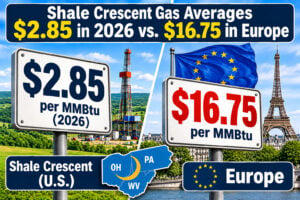 Every so often someone sends us a graphic so good we just have to share it. This is one of those times. Shale Crescent USA, the Marietta, Ohio-based economic development group that markets the Ohio Valley region of Ohio, West Virginia, and Pennsylvania to energy-hungry manufacturers, partnered with Visual Capitalist on a chart tracking 20 years of natural gas prices in our region against the rest of the world. The bottom line: from January through September of this year, gas in the Shale Crescent region averaged $2.85 per MMBtu. That’s about 22% below the U.S. benchmark Henry Hub ($3.65), and roughly 83% below Europe ($16.75) and Asia ($17.75). Cheap, reliable gas, year in and year out. Here’s the picture.
The Graphic
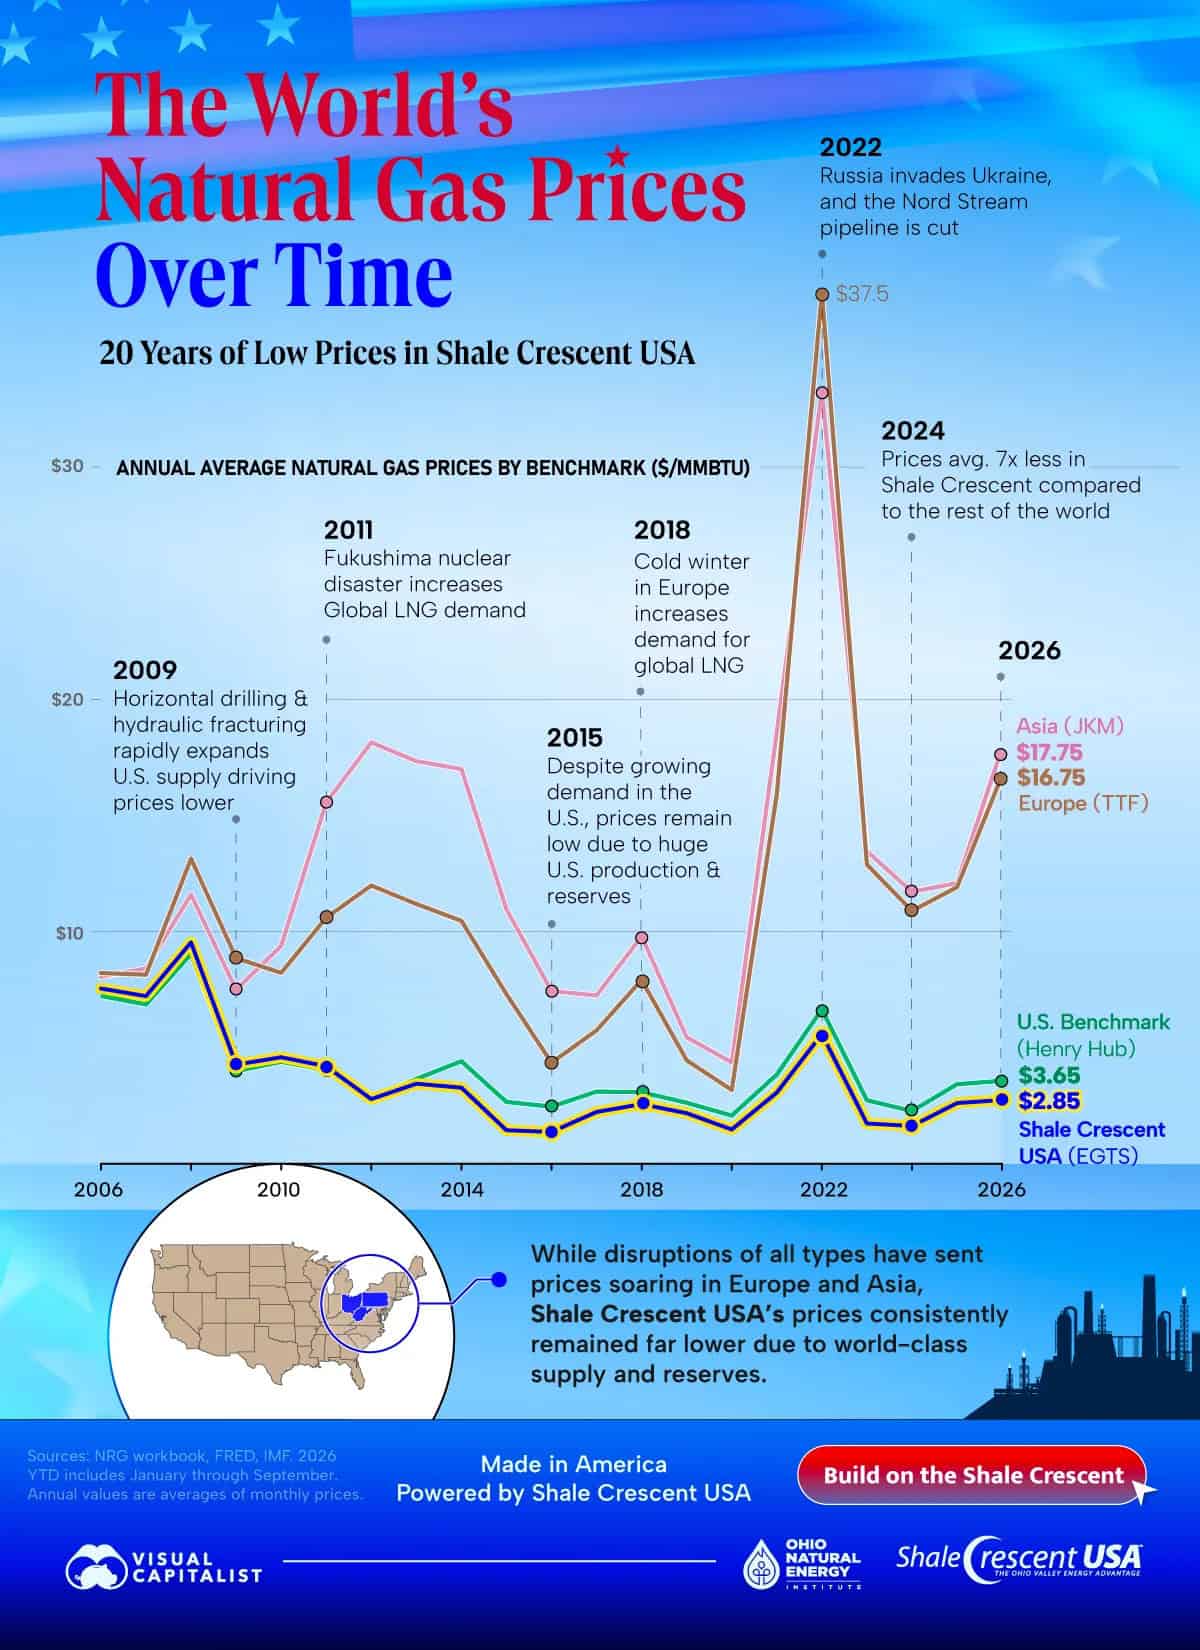
Graphic: Visual Capitalist, in partnership with Shale Crescent USA and the Ohio Natural Energy Institute. 2026 figures are January–September averages.
What the Chart Shows
The chart tracks annual average prices at four benchmarks (the hubs where gas prices are set), all in dollars per MMBtu (million British thermal units, roughly what’s in 1,000 cubic feet, or 1 Mcf, of gas):
- Henry Hub – the Louisiana hub that serves as the main U.S. price.
- EGTS – Eastern Gas Transmission and Storage, a big interstate pipeline system that runs through the heart of the Marcellus/Utica. It stands in here for “the Shale Crescent price.”
- TTF – the Dutch hub that sets Europe’s price.
- JKM – the Japan-Korea Marker, the main price for LNG (liquefied natural gas) shipped to Asia.
The graphic flags the events that sent overseas prices soaring, starting with the Fukushima nuclear disaster in 2011 (which boosted Asian LNG demand). The biggest was Russia’s 2022 invasion of Ukraine. That year Europe averaged $37.52 and Asia $33.30, while the Shale Crescent averaged $5.59. The article also points to LNG shipping disruptions from this year’s war in Iran, which has choked traffic through the Strait of Hormuz since late February. Through it all, the price here barely flinched compared to overseas hubs. In 2024, the graphic says prices here were about 7x lower than the rest of the world. We checked the math: it’s 6.9x the average of Europe and Asia. Close enough!
The Numbers Behind the Picture
The article includes a table of annual prices going all the way back to 2000, six years before the graphic starts. MDN ran the numbers, and a few things jump out:
- Before shale, we paid MORE than Henry Hub. From 2000 through 2011, the EGTS price ran above Henry Hub every single year, by an average of about $0.32/MMBtu. The Northeast used to import its gas from the Gulf Coast, so it paid a premium for the pipeline ride.
- Before shale, Europe paid LESS than we did. From 2000 through 2005, Europe’s TTF price was below EGTS every year. Let that sink in.
- Then the shale revolution flipped the script. The Shale Crescent price fell below Henry Hub starting in 2013 (2012 by the article’s unrounded math) and has stayed there every year since. From 2013 through 2025, the discount averaged about $0.80/MMBtu.
We built our own chart to show the flip. Red bars are years our region’s gas cost more than Henry Hub; blue bars are years it cost less:
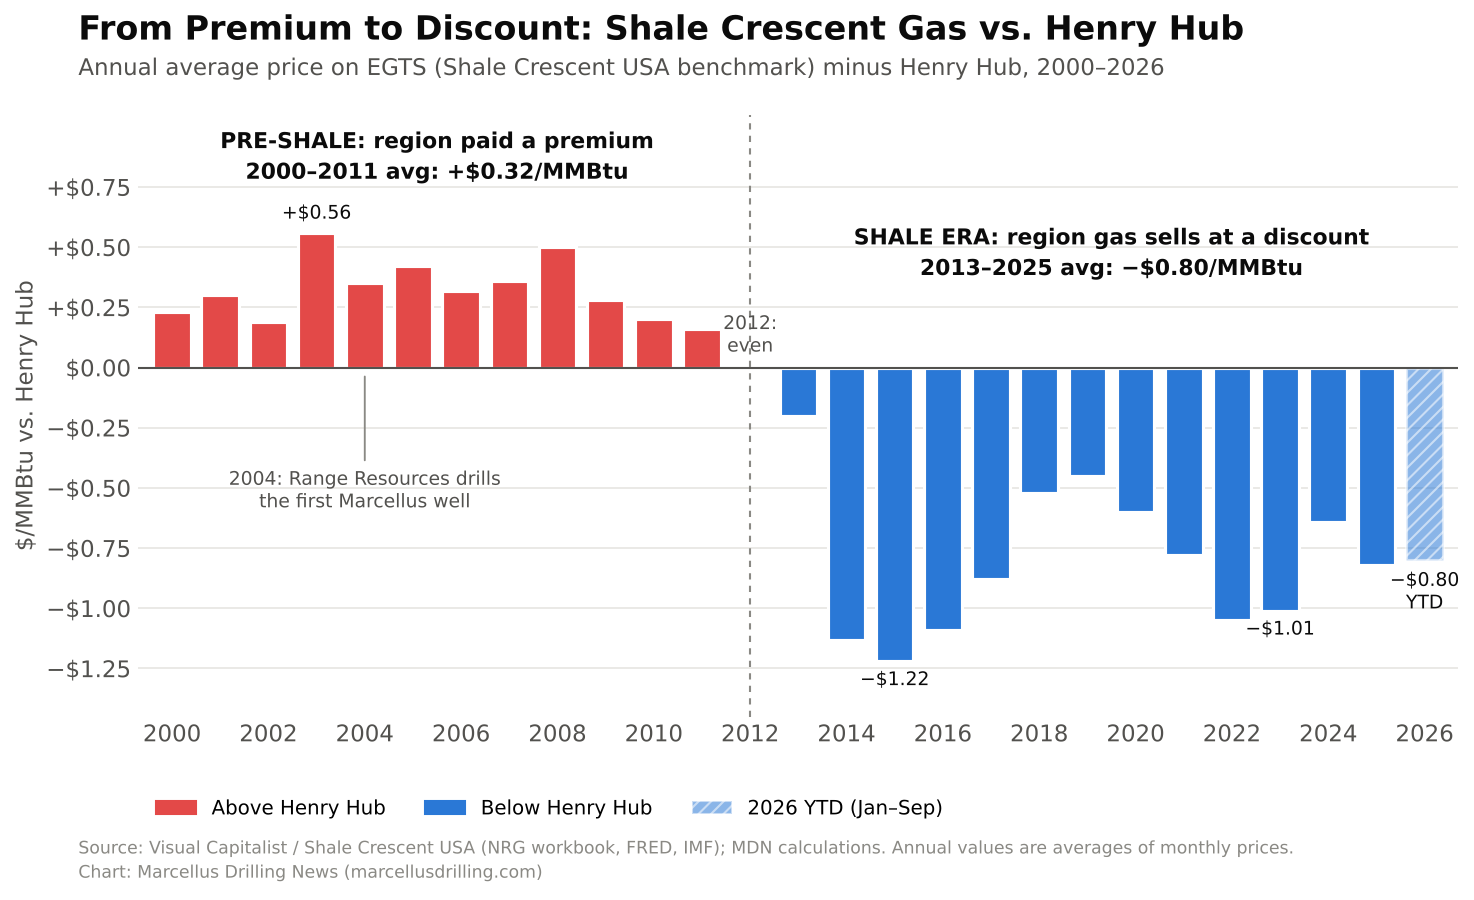
In other words, the Marcellus and Utica turned Appalachia from a high-priced gas importer into one of the lowest-cost gas regions on the planet in about a decade.
MDN’s Take
This graphic will get plenty of mileage, and it should. It makes the case Shale Crescent has been making since 2016 better than any slide deck could. If you run a factory, a chemical plant, or a data center and you’re choosing where to build, here’s 20 years of proof that our gas is cheap and stays cheap when the world goes haywire. That’s exactly why gas-fired power and data center projects keep landing in Pennsylvania and Ohio.
But let’s be honest with our landowner and driller readers. You may have looked at that thick blue line hugging the bottom of the chart and winced. That “advantage” for manufacturers is the same basis discount that shrinks royalty checks. Every dime EGTS trades below Henry Hub is a dime that doesn’t reach a lessor in Washington County or Belmont County. Low prices are great if you’re buying gas and not so great if you’re selling it.
The good news is that the fix for both sides is the same: more demand. Build more pipelines to get our gas out to the Southeast, New England, and LNG export terminals, and put more gas-burning factories and power plants right here at home. Both shrink the discount. Shale Crescent is working on the “right here at home” part. The “more pipelines” part is up to regulators, courts, and a few governors who still haven’t figured out that Europe would kill for a $2.85 gas price.
Sources:
- Visual Capitalist / Ryan Bellefontaine (Oct 20, 2026) – The World’s Natural Gas Prices Over Time (2006–2026)