
2 NOAA Graphics Drove NYMEX NatGas Price Down 20.5 Cents Yesterday
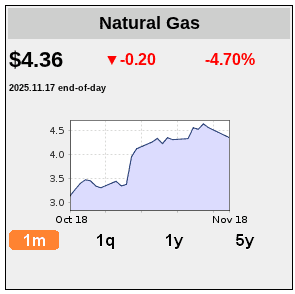 The NYMEX “front month” futures price for natural gas took a dive yesterday, down 20.5 cents (4.5%) in a single day. The price remains firmly in the $4 range, closing at $4.361 per million British thermal units (MMBtus). We thought it would be a good time to check in on the price—what the futures price has been doing, and what the spot/physically traded price in the Marcellus/Utica region has been doing. We can sum up why the price tanked yesterday in a single word: weather. Expanding on that just a bit, NOAA (the National Oceanic and Atmospheric Administration) released its 6-10 Day and 8-14 Day Temperature Outlook graphics yesterday, showing most of the country (in particular the Northeast) will experience warmer than average temperatures for 6-10 days, with the Northeast experiencing warm temperatures all the way through the end of this month and into December. Read More “2 NOAA Graphics Drove NYMEX NatGas Price Down 20.5 Cents Yesterday”
 U.S. retail natural gas prices are rising across all sectors due to higher wholesale costs, particularly the Henry Hub spot price, which is expected to increase by 58% in 2025 compared to 2024. This increase translates unevenly to consumers. Electric power plants and the industrial sector are expected to see the most significant price hikes, forecast at 37% and 21%, respectively, as their costs are more directly tied to fluctuations in wholesale prices. Residential and commercial customers, however, are expected to experience smaller increases of 4% each. This smaller impact is due to utilities adjusting their rates more gradually, and wholesale commodity costs constitute a smaller portion of the final retail bill for these sectors, which also include significant fixed charges for transportation and distribution.
  The U.S. Energy Information Administration (EIA) issued its latest monthly Short-Term Energy Outlook (STEO) yesterday. The STEO is the agency’s monthly best estimate of where energy prices and production will head over the next 12 months. In this latest assessment, EIA reversed its months-long trend of lowering its estimates for the Henry Hub spot price for 2025. The agency expects the HH spot price to average $3.50 per million British thermal units (MMBtu) in 2025, $0.10 higher than last month’s forecast. EIA also raised its 2026 forecast by $0.10 to $4.00/MMBtu. Recent soaring HH prices appear to have influenced the official price dartboard at EIA HQ.
  Marcellus/Utica natural gas production is rebounding in November, increasing by about 700 MMcf/d to an average of 35.5 Bcf/d recently, as drillers react to rising in-basin pricing and tightening regional fundamentals due to higher seasonal demand. This increase signifies an easing of the production shut-ins carried out during the third quarter when loose supply-demand dynamics pushed prices, which averaged $1.40-$2.97/MMBtu, to an average of below $2/MMBtu on more than a third of days.
  The NYMEX futures price for natural gas was a rocket ship over the past two weeks. The NYMEX price closed at $4.1240/MMBtu on Friday, breaking the $4 barrier barely a month after we struggled to break the $3 barrier. In October, the NYMEX front-month contract rose an astounding 82.10 cents per MMBtu, or 25%. In one month! October was the largest one-month gain since August 2022, and the largest one-month percentage gain since February 2025. Zooming out a bit, the NYMEX price was up $1.127 or 38% over the last two months. However, spot prices (at least in the Marcellus/Utica) are more of a mixed bag.
  We’ve noticed something that, in our opinion, is very unusual. In reviewing the most recent NYMEX natural gas futures prices and comparing spot (physical) prices at various trading hubs in the northeast, we discovered that over the past week, the spot price in the Marcellus/Utica has risen by roughly $1.00 per MMBtu. Current spot prices in the M-U are now within 25 cents of the Henry Hub spot price, the “benchmark” for all natural gas prices nationwide.
  For over 30 years, the Henry Hub in Louisiana has served as the key anchor for natural gas pricing in the contiguous United States. Its role, however, has dramatically evolved over the last decade, primarily due to the rapid growth of U.S. LNG exports. Henry Hub has shifted from being a benchmark for U.S. natural gas to the primary index for global LNG cargo pricing. Consequently, the volume of physical gas exchanged at the hub is at its highest, and Henry Hub prices are now considered a premium compared to other domestic markets.
  The front-month NYMEX natural gas futures price soared yesterday (the biggest one-day increase in more than three months), closing up +0.389 (+12.93%) at $3.397/MMBtu. Why? In a word, weather. The price jumped based on forecasts for much colder weather and higher heating demand over the next two weeks than previously expected. Also playing a role is a decline in natural gas output this month and near-record flows of gas to LNG export plants. LSEG (London Stock Exchange Group) said average gas output in the Lower 48 states fell to 106.6 billion cubic feet per day (Bcf/d) so far in October, down from 107.4 Bcf/d in September and a record monthly high of 108.0 Bcf/d in August.
  The U.S. Energy Information Administration (EIA) issued its latest monthly Short-Term Energy Outlook (STEO) yesterday. The STEO is the agency’s monthly best guess about where energy prices and production will head in the next 12 months. In this latest assessment, EIA dropped its estimates for the Henry Hub spot price for 2025, again, as it has for months. The agency expects the HH spot price to average $3.40 per million British thermal units (MMBtu) in 2025, $0.10 lower than last month’s forecast (and $0.30 below the prediction from three months ago). EIA also dropped its 2026 forecast, quite radically, lowering it by $0.40 to $3.90/MMBtu. Hence, our suspicion that sometimes the data crunchers haul out the breakroom dartboard to help with forecasts.
  Although we’re seeing an increase in both natural gas demand and production, combining these factors with relatively normal winter weather, economic indicators and natural gas storage levels, the Natural Gas Supply Association (NGSA) is projecting “flat” pressure on natural gas prices compared to last winter, according to the NGSA’s annual Winter Outlook forecast of the wholesale winter natural gas market (full copy below). The NGSA 2025-2026 Winter Outlook, a forecast of the wholesale winter natural gas market, compared the upcoming winter to the winter of 2024-2025 when the average Henry Hub price of natural gas was $3.76 per MMBtu. “Winter” is defined as the period from November through March, the industry’s traditional winter heating season.
  Yesterday, the NYMEX “front month” futures contract for natural gas declined once again, marking four consecutive days of losses. The NYMEX price fell 8.20 cents per million British thermal units (MMBtus) to $2.806 per MMBtus. Why the slide? The best thinking we could find says (a) the weather isn’t warm or cold enough to draw down stocks, and (b) we have more than enough extra gas sitting in inventory. Classic economics 101 states that a surplus of supply over demand results in falling prices. How much longer will the price continue to decline? Gas traders speculate that the short-term outlook is “bearish,” meaning the price will continue to decline. However, in the not-too-distant future, they predict a turnaround and higher prices.
  It finally happened. After the front-month NYMEX natural gas futures price closed above $3 on September 2, it once again sank below a $3 closing price at yesterday’s close. The price closed down 9.5 cents yesterday at $2.934 per million British thermal units (MMBtus). On the bright side, the price is still 8.8% higher than the lowest price (so far) in 2025, which was $2.696 hit on Monday, Aug. 25. Where do we go from here? And, is the futures price affecting regional spot prices in the Marcellus/Utica?
  According to the Financial Times (of London), the world’s biggest oil and gas companies are cutting jobs, slashing costs, and scaling back investments at the fastest pace since the coronavirus market collapse, as executives brace for a prolonged period of lower crude prices. The reason for the cuts is low oil prices, which FT says have hit the U.S. shale industry “particularly hard.” There is no denying that the price has steadily sunk to new lows each month over the past year. However, we now appear to be entrenched in the $60s, although that could change.
  The U.S. Energy Information Administration (EIA) issued its latest monthly Short-Term Energy Outlook (STEO) yesterday. The STEO is the agency’s monthly best guess about where energy prices and production will head in the next 12 months. In this latest assessment, EIA dropped its estimates for the Henry Hub spot price for 2025, again. The agency expects the HH spot price to average $3.50 per million British thermal units (MMBtu) in 2025, $0.10 lower than last month’s forecast (and $0.20 below the prediction from two months ago). EIA kept its 2026 forecast the same, predicting the gas price will average $4.30/MMBtu.