
Auburn U Study Finds Hydrogen is WORSE Than CO2 for Global Warming
 A big, fat, red flag has just been waved by researchers at Auburn University and Stanford University regarding the future of hydrogen as a nirvana energy source. A new study published in the esteemed scientific journal Nature suggests that embracing a “hydrogen economy” will require a deeper scientific understanding of the global hydrogen cycle to support a climate-safe, sustainable hydrogen economy. Unlike greenhouse gases, including carbon dioxide (CO2) and methane (CH4), hydrogen itself does not trap heat in Earth’s atmosphere. Through interactions with other gases, however, hydrogen indirectly heats the atmosphere roughly 11 times faster than carbon dioxide during the first 100 years after release, and approximately 37 times faster during the first 20 years. Oh, oh, that certainly doesn’t fit the environmental left’s narrative! Read More “Auburn U Study Finds Hydrogen is WORSE Than CO2 for Global Warming”
 The Marcellus/Utica rig count gained 1 rig two weeks ago in the Ohio Utica. The combined count hit 39 total rigs. Last week, the M-U maintained that count—the most rigs it has operated in more than a year. Pennsylvania has held at 18 active rigs for five consecutive weeks. Ohio picked up 1 rig two weeks ago and now operates 14 rigs. West Virginia maintained its 7 rigs, which it has operated since May 30. There were 24 rigs targeting the Marcellus and 15 targeting the Utica, for a combined 39 rigs in the M-U. The national count did not fare so well, losing 6 rigs, down to 542 active rigs, the lowest national count since September.
 U.S. natural gas production and demand reached record highs in 2025, with the U.S. Energy Information Administration (EIA) projecting continued growth in output and LNG exports through 2026. Driven by surging international demand in Europe and Asia, the U.S. has become the world’s largest LNG exporter. This natural gas resurgence is bolstered by the Trump administration’s support and significant investments from major energy firms prioritizing gas as a so-called transition fuel (it’s actually a destination fuel). Consequently, U.S. natural gas pipeline capacity is set for its biggest one-year expansion since 2008. Surging demand from LNG exporters, data centers, and manufacturing is driving a $50 billion investment boom.
 The U.S. Energy Information Administration (EIA) issued its latest monthly Short-Term Energy Outlook (STEO) yesterday. The STEO is the agency’s monthly best estimate of where energy prices and production will head over the next 12 months. In this latest assessment, EIA forecasts the cold snap hitting the United States this month will drive the Henry Hub natural gas spot price to average almost $4.30 per million British thermal units (MMBtu) this winter, which is 40 cents/MMBtu higher than its November forecast of $3.90. The price increase is driven by increased natural gas consumption for space heating.
  Yesterday, the Pennsylvania Independent Fiscal Office (IFO) released its latest quarterly Natural Gas Production Report for July through September 2025 (full copy below). There were 116 new horizontal wells spud (drilled) in 3Q25, a huge increase of 53 wells (+84%) compared to 3Q24. Natural gas production volume was 1,934 billion cubic feet (Bcf) in 3Q25, up 93 Bcf (+5%) from 1,841 Bcf produced in 3Q24. The average Pennsylvania spot hub price was $2.18, an increase of $0.74 (+51%) from the prior year’s $1.44. All in all, it was a great third quarter for the PA Marcellus. The numbers are going in the right direction.
  Wondering how your business can profit from the Marcellus/Utica with production and drilling on the increase once again? A
  There have been a number of new reports recently released predicting how new AI data center projects will affect (a) demand for electric power, and (b) demand for natural gas to generate that power. We spotted what at first glance appears to be contradictory predictions in two new reports issued this week. On Monday, BloombergNEF (the research arm of Bloomberg) issued a report predicting data center power demand will hit 106 gigawatts (GW) by 2035, a 36% jump from its previous outlook. Two days later, Enverus Intelligence® Research (EIR), a subsidiary of Enverus, issued a report that predicts 30 GW of new U.S. data center capacity will be needed over the next five years (by 2030)—significantly below the 50 GW forecasted by major grid operators. One report is wildly optimistic, the other pessimistic. What gives?
  Last week, the Baker Hughes U.S. national rig count got wacked good, losing 10 rigs from the previous week. The national count went from 554 to 544 (as of Wednesday, when BH reported the numbers). Bummer. It had gained rigs for each of the prior three weeks. Rigs in the Marcellus/Utica remained the same last week after gaining one rig the week before. Pennsylvania has held at 18 for two weeks in a row. Ohio was the same at 13 rigs, which it has operated since September 26. West Virginia maintained its 7 rigs, which it has operated since May 30. There were 24 rigs targeting the Marcellus and 14 targeting the Utica, for a combined 38 rigs in the M-U.
  The American Energy + AI Initiative, a collaboration between the Hamm Institute and the American Energy + AI Coalition, held a summit on Monday in Washington, D.C., to address the urgent need for firm power to sustain the rapid growth of Artificial Intelligence (AI) in the U.S. Cabinet officials, including DOE Secretary Chris Wright, and industry leaders, discussed concrete steps to modernize federal tools and accelerate power production. During the summit, a new study was released (full copy below) emphasizing that America’s ability to lead in AI depends on quickly building reliable energy and highlighted the immediate need for more natural gas to meet the massive, unexpected demand from data centers.
 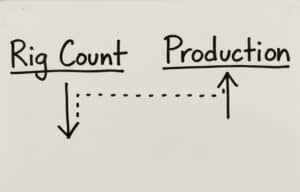 The average number of active oil and natural gas rigs in the U.S. Lower 48 dropped sharply from 750 in late 2022 to 517 in October 2025, driven by lower prices and efficiency improvements. Despite this 31% decline, crude oil and natural gas production reached record highs as operators focused on the most productive areas, utilizing longer lateral lengths and advanced completion techniques. The Permian and Marcellus/Utica (Appalachia) regions exemplify this, with production growing significantly even as rig counts fell by 29%. For 2026, EIA forecasts a slight decline in oil production, constrained by lower WTI prices (predicted at $51/barrel). Natural gas output, however, is expected to increase slightly, supported by rising Henry Hub prices (predicted at $4.02/MMBtu) that will encourage gas-directed drilling.